
Working Demonstration · BI
Revenue BI & Reconciliation
Historical spreadsheets and current systems can produce different revenue figures. This example shows how to explain those differences.
Combine historical and current revenue data, reconcile overlaps and trace every dashboard number back to its source.
Independent working demonstration using synthetic data. Not a client deployment.
Try this scenario
- Inspect the three source datasets.
- Review the July historical overlap.
- Open the Northstar customer mapping exception.
- Map Northstar to CUST-1042.
- Re-run reconciliation.
- Verify Reconciliation PASS and the remaining source-quality warnings.
- Open Revenue Dashboard.
- Trace July revenue back to ERP invoices.
- Download the evidence report.
Python · DuckDB · CSV / XLSX
From exports to a traceable reconciliation
Compare two differently structured exports, flag ambiguous duplicates and trace each difference to its source rows. This companion project produces an HTML report, an Excel review workbook and a repeatable evidence package.
Independent engineering example with synthetic data. Includes source code, failure tests and a recorded walkthrough.Sources
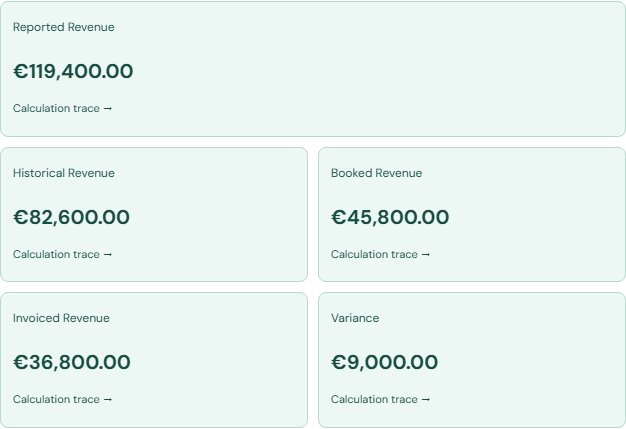
Representative ERP / CRM / historical-export data model. Historical EUR 64,200 is separate from the additional Northstar EUR 18,400; both are dated no later than June 2026. Raw totals include excluded records. Unknown currencies have separate buckets.
Synthetic EUR reporting model. No real ERP/CRM connection, no FX conversion, no accounting-standard certification. Reports are scoped to this browser session and expire after about 24 hours. Reset restores the original data and mapping; run IDs and generation timestamps are new.